Our fertility chart is designed to help you understand your fertility through charting, using this graph, and a pen. Understanding your fertility can help you achieve pregnancy or even avoid one.
The chart we have will help you track the following things:
- The days when you have intercourse
- Your body temperature – also known as your basal body temperature (BBT) – which is your body temperature when you are resting. You can track your BBT to identify when you are ovulating. With this, you can learn when you are most and least likely to become pregnant.
Click to download our fertility chart
When are you most likely to become pregnant?
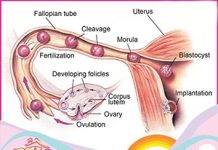
About 2 weeks before your period you will ovulate. You are most likely to get pregnant on the day of ovulation and the 5 days before it.
When are you least likely to become pregnant?
Your egg is fertile for about 12 to 24 hours after you ovulate. Avoiding sex until several days after ovulation may help you prevent pregnancy. It’s important to note that your cycle can change making it difficult to know when you are ovulating.
Predicting when you will ovulate
Your body temperature decreases a little just before your ovary releases an egg. Then, 24 hours after the egg’s release, your temperature rises and stays up for several days.
You can track your cycle by taking your BBT every morning. You should take your temperature at the same time every day before getting out of bed and record the results on a chart. If you have a somewhat regular cycle, the chart can help you predict when you will ovulate next.
Click to download our fertility chart
- Your cervical mucus
Before ovulation occurs your BBT will be relatively low. Immediately following ovulation, your body begins to produce the hormone progesterone which has a warming effect on your body and causes your BBT to increase. The temperature shift is very subtle usually less than 0.5 degrees but by charting your BBT daily throughout your cycle, you will be able to identify this shift and know when you are ovulating. To track your BBT you will need a digital or glass basal thermometer. The ovulation chart we have provided will help you keep track of your temperature. For the best results, be sure to take your temperature at the same time each day, immediately upon waking and before you get out of bed.
The Cervical mucus or cervical fluid is another powerful fertility sign to help identify your fertility days in your chart. Cervical mucus production is regulated by the hormone Estrogen so the consistency and quantity of cervical mucus changes throughout your menstrual cycle in response to the ups and downs of estrogen production.
Immediately following your period, cervical mucus production is low and many women describe themselves as dry. As you move through your cycle, estrogen begins to build and you will see more cervical mucus that might have a creamy appearance. Once ovulation is imminent, estrogen surges which cause the consistency of your cervical mucus to become slippery and stretchy resembling egg whites. This type of cervical mucus plays an important role in fertility as both a predictive sign of ovulation and also as a substance to protect sperm as it travels through the reproductive tract. Just like BBT charting, tracking changes in your cervical fluid will require that you note the type of cervical mucus you have on the chart.
Click to download our fertility chart


